
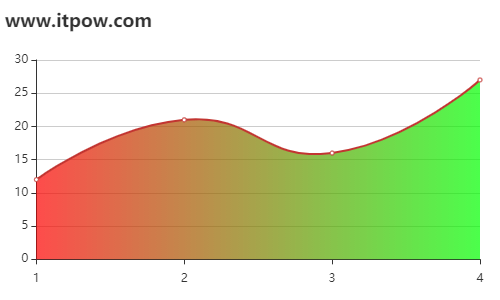
核心代码
option.series.push({
	name: "序列1",
	type: "line",
	data: [12, 21, 16, 27],
	smooth: true,
	areaStyle: {
		color: {
			colorStops: [{
				offset: 0, color: '#f00'
			}, {
				offset: 1, color: '#0f0'
			}]
		}
	}
});
效果
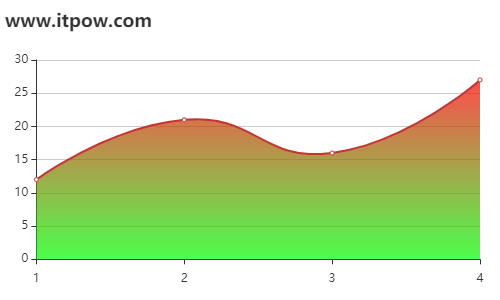
改变角度
option.series.push({
	name: "序列1",
	type: "line",
	data: [12, 21, 16, 27],
	smooth: true,
	areaStyle: {
		color: {
			x:0,
			y:0,
			x2:0,
			y2:1,
			colorStops: [{
				offset: 0, color: '#f00'
			}, {
				offset: 1, color: '#0f0'
			}]
		}
	}
});
效果
更多参数

